
How Do We Actually Find Oil?
Geological Modeling for Dummies
I write about crypto currencies, rockets and space colonization but my actual job involved making software for geological modeling.
Geological modeling involves creating computer models of the subsurface, meaning the structure of the layers of rock below the ground. Geologists do this to figure out where there might be oil and where they ought to drill.
When I learn about geology in high school I found it to be a rather boring subject. I did not find it very interesting to memorize a bunch of rock types. Nor did I see any clear purpose or application of this knowledge.
Working as a software developer in this field, changed my perspective a lot, to the point of thinking that under other circumstances I could have chosen to be a geologist.
What makes geology exciting in this context, is that finding out where the oil is, how much there is and you can best extract it, is like elaborate detective work. The detective picks ups various clues and combine them to piece together what events must have happened, leading up to the crime.
Likewise the geologists must collect various clues or data, to be more specific, which he can use to piece together the geological events which have occurred.
All the various data is collected and imported into software for geological modeling. This software has tools to analyze the data and look for clues which can then be utilized to build up a 3D model of the subsurface containing all the important features.
What Exactly Are We Looking For?
Hydrocarbons such as oil and gas are not scattered about completely random. There are particular geological features which significantly increase the likelihood of us finding oil there. Looking for oil means looking for these geological features.
Whatever feature we are looking for there is a common pattern. You need some kind of oil trap. Oil flows upwards and so we are looking for some geological feature which can trap oil, so that it concentrates in a limited area.
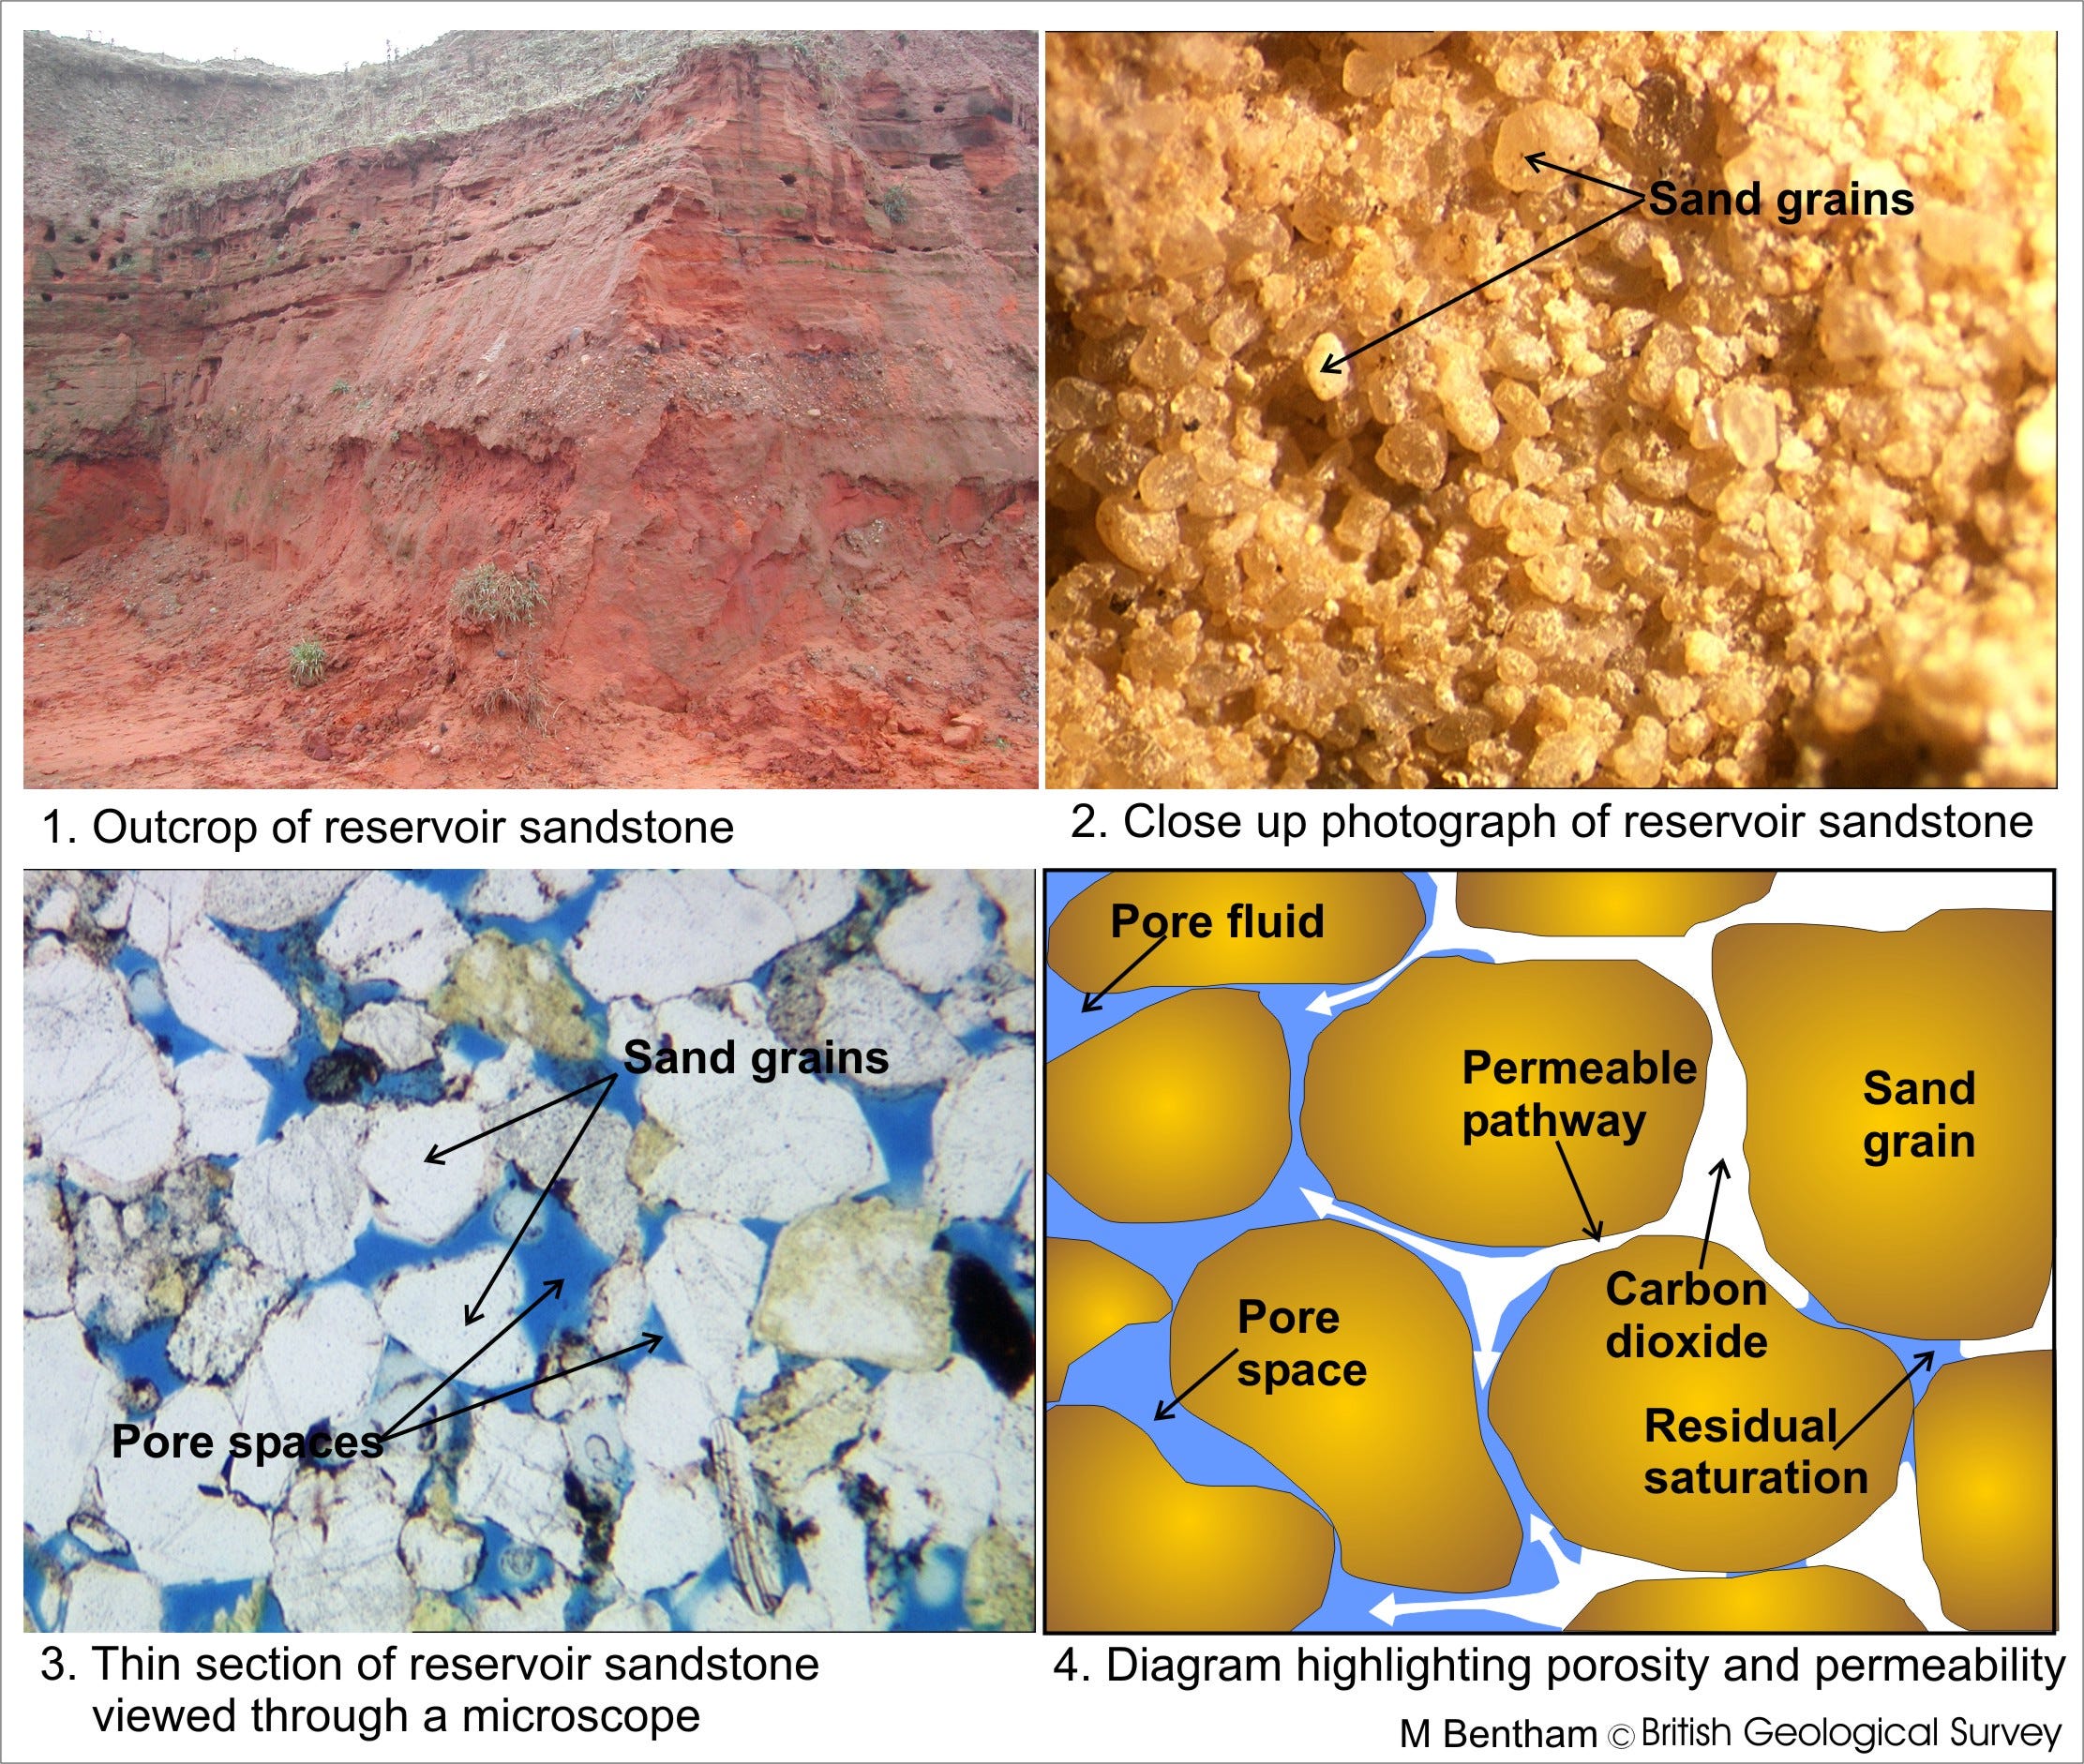
Unlike typical cartoon depictions of oil reservoirs, the oil isn’t stored underground in a sort of hollow cave. As strange as it sounds, the oil is actually stored inside the rock itself. Of course oil can’t be stored in any kind of rock. We need a porous rock with lots of little cavities and channels where the oil can reside.
Typically that means a sandstone. So basically a stone which has formed by compression of sand. In some distant past, there must have been a beach, river or something similar which has deposited sand in large quantities which then later has been covered by countless other layers of rock, applying enough pressure on the sand to turn it into sand stone.

The sand stone needs to be covered above by a cap rock, such as shale which is not permeable. That is just a fancy way of saying liquids can’t flow through the rock.
We also need the cap rock to be shaped like some sort of funnel, so that oil can collect below it as it moves upwards. There are a lot of different ways this can happen. Below are various examples of rock formations which help trap the oil.

So the geologist focus on locating such rock formations, made of rock of the right kind of type.
Fault Traps
A fault is what you get when two rock layers shift, relative to each other. When that happens you typically get an earth quake. When one shifts up in an angle, you potentially create a trap for the oil.
That is why when you doing geological modeling figuring out where the faults are is a big deal. You really want to locate and model your fault lines correctly.
How to Piece Together the Puzzle and Build a Model
To create a model where you can see the different types of rock layers, and location of features such as faults, which can trap oil.
In the old days, people would just drill oil a bit on random to see if they would get lucky and find oil. That is why big land based oil fields in e.g. Oklahoma or California looked like forests of oil rigs.

After a while they got a bit more clever and they would take out rock samples from the wells and different depths. By looking at these rock samples at different locations you could interpolate to guess what the ground looked like in areas you had not drilled yet. E.g. if you find shale and then sand stone at 20 meters in one location, but its at 40 meters depth in another location, then you can conclude that the rock formation in between isn’t completely flat.
The next step was to lower down measuring instruments with a rope and measure properties of the rocks below at different depth. It could e.g. be done by attempting to send electric current through the rock and see how well it conducts electricity. Sand stone filled with water will e.g. conduct a lot better than if it is filled with oil or gas.
Measuring at different depth produces data we call well logs.
In Norway, where I live, we got no land based oil wells. All the oil is retrieved from offshore oil platforms. That is one of the reasons oil production in Norway started much later than say in Texas. It is very difficult to drill at sea. In Texas the oil is often not much deeper than 20 meters down. The first oil discovery on the Norwegian shelf was almost 3000 meters down. Naturally under such conditions you can go around drilling oil wells at random looking for oil.
Onshore oil wells cost millions, oil platforms cost billions. For this reason offshore oil drilling pushed the development of geological modeling using seismic data. Survey ships back in the day would blow up some dynamite to create massive sound waves traveling through the water and the ground.
If you think about light, you know that when you look into the water, there is a reflection. That is because light reflects at the intersection between materials with different properties. It is the same with sound. So whenever there is a change in the type of rock underground, you will get a reflection of the sound.
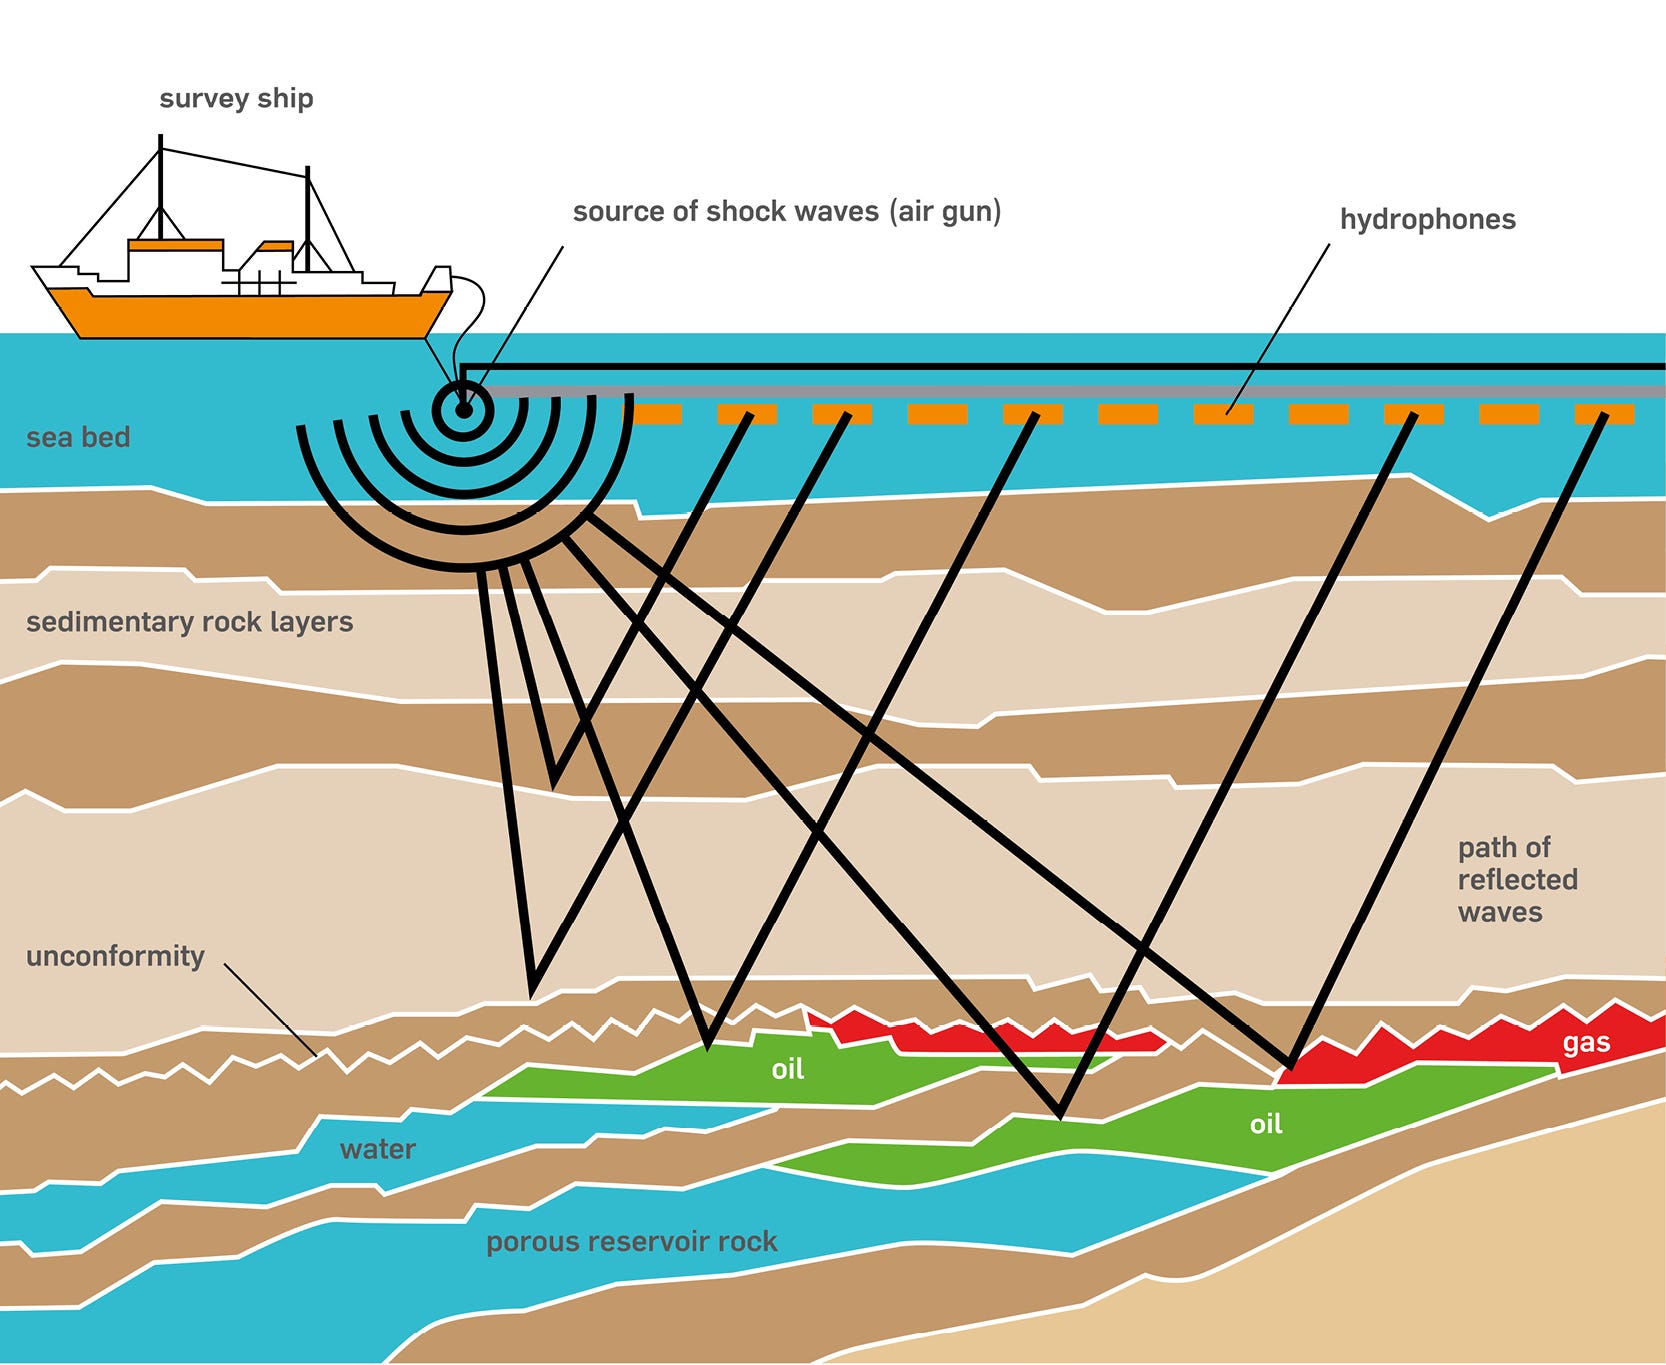
A type of microphones, called hydrophones are spread across the water surface. These collect the reflected sound waves. The hydrophones are pulled after the survey ship so it can move around and shoot seismic. Shooting seismic basically means generating sound (an acoustic signal) and recording it.

This is turned into data we call seismic cubes. It is a 3D voxel structure, which in geological software is shown by coloring the acoustic responses in different colors, so that e.g. areas where there was a strong reflection have brighter colors.
This allows us to get a sense of the layering of rocks and their shape. What it doesn’t tell is however is how deep these different rock formations are or what they are made of. We only see where one rock formation begins and ends, measured in milliseconds.
This is an important concept in geological modeling. Almost all data we work with is tagged with what domain it is in. A domain is the bag term for whether depths are measured in time units or length units such as meters or feet.
We need to be able to convert this time based data into depth based data. This is where the detective work comes into play. We can combine clues. Typically we have done a few test drillings and recorded well logs. That means judging by the well logs we can see transitions between different rock layers measured in depth.

We can compare these logs with the seismic data. If we can locate a layer measured in time which looks like a layer from the well log measured in depth, then we are able to assign a depth value to a specific time value.
How we do this is quite intricate. We can e.g. measure the acoustic properties of rocks with a well log. At different depths check how fast the sound travels through the rock. This means through a bunch of complicated calculations we can create a sort of fake seismic signal which we can compare with the real seismic. A geologist can in the software stretch and squeeze this fake seismic until it matches the seismic from the survey ship in the area around the well.

The software will keep track of the stretching and squeezing to calculate the relationship between different depths in time. Once we have derived this relationship between time and depth in multiple wells, we can interpolate between them using the seismic cube to guide us.
That allows us to produce meshes or 3D surfaces measured in time called horizons. Horizons indicate the intersection between two different rock layers.

We are not done at this point though. We need to figure out what kind of rocks exist between the different rock layers and their properties. We also want to know their properties. E.g. what is the porosity of the sandstone. If it has great porosity, it has potential for containing a lot of oil. But if it has low permeability, then the small cavities are not well connected and the oil can’t easily from the reservoir into your oil well.
That is why we create data structures called zones representing the area between the horizons. By looking at the well logs geologists try to determine rock properties and type. This kind of work requires a lot of statistics and correlation. The log data we get are things like:
- Gamma logs, measuring gamma rays emitted from the rock.
- Neutrino logs, measuring neutrino particle densities.
- Resistivity logs. Measure the electric resistance.
- Sonic log, measure the time it takes for sound to travel through the rock.
In short none really measures directly the properties we are after such as porosity and permeability. We have to use knowledge about statistical relationships between the logs we have measured and the properties we are interested in.
But we are still not done, because the difference between rock types doesn’t occur just layer by layer. There could have been meandering rivers, beaches etc which deposited sand which turned into the sandstone we see. We need a more detailed modeling, because our oil reservoir is not going to be one homogenous chunk of sandstone.
That is why we create a grid which means we split up our whole model into lots of little cells, which are typically cube shaped. To each cell we can assign different values for porosity, permeability and rock type.

This allows us to perform calculations of how much total space there is in the reservoir for oil.
Usually a reservoir is a very complex thing. There are different pressures and as you produce oil fluids such as oil, gas and water will move around inside the reservoir and affect how much oil you can produce. That is why we run simulations on these grid models to predict how oil production will be over time.
Loops and History Matching
The way I have presented all of this thus far is as if the process moves in just one direction all the time. But really it is made up of bigger and smaller loops. You are always gaining more data over time. You drill more wells and get more well logs. As you produce oil over longer time you can match actual production with what you predicted. We call that history matching. All of this is used to continuously improve our geological model of an oil field so we can discover new places to get oil or get a better idea of future oil production.
Next, Data Representation of Geological Models
Okay I left out a lot of details, but I hope this gave an overview of how a geologist works and how we find oil. Next I want to write more about the specifics of the data types we use to model the oil reservoir and subsurface, and how they are related.
My intended audience is people who are not geologists but who are perhaps software developers and want to understand better how this kind of software is made.
